8 November 2022, Palestinian Central Bureau of Statistics (PCBS) [English / Arabic]
| DATA* | OPT | WB | GS | cf. Israel^ | cf. Aust.^^ | Data Table |
| Labour force participation rate (15+yrs) | 46% | 48% | 42% | 62% | 66% | #1 |
| – (participation rate) Males | 72% | 76% | 65% | 65% | 71% | |
| – (participation rate) Females | 19% | 19% | 19% | 59% | 61% | |
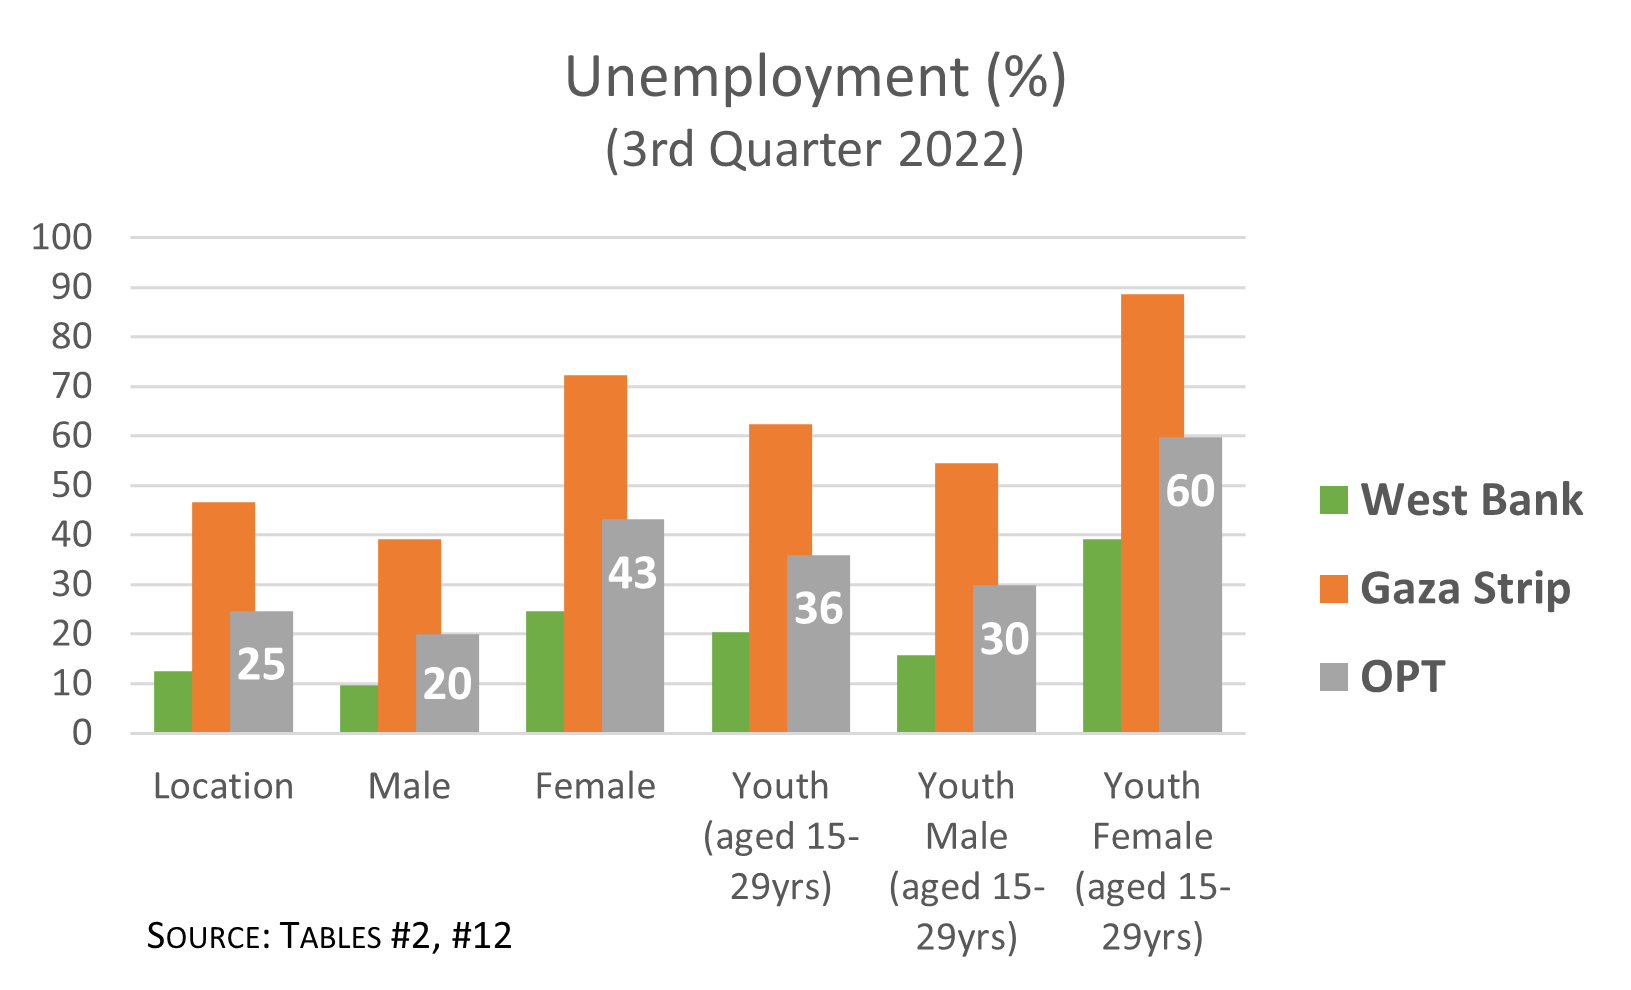
| Unemployment rate | 25% | 13% | 47% | 5% | 5% | #2 |
| – (unemployment rate) Males | 20% | 10% | 39% | 5% | 5% | |
| – (unemployment rate) Females | 43% | 25% | 72% | 5% | 5% | |
| Youth unemployment rate (15-29yrs) | 36% | 20% | 62% | 8% | 11% | #12 |
| – (youth unempl.) Males | 30% | 16% | 54% | 8% | 13% | |
| – (youth unempl.) Females | 60% | 39% | 89% | 8% | 10% | |
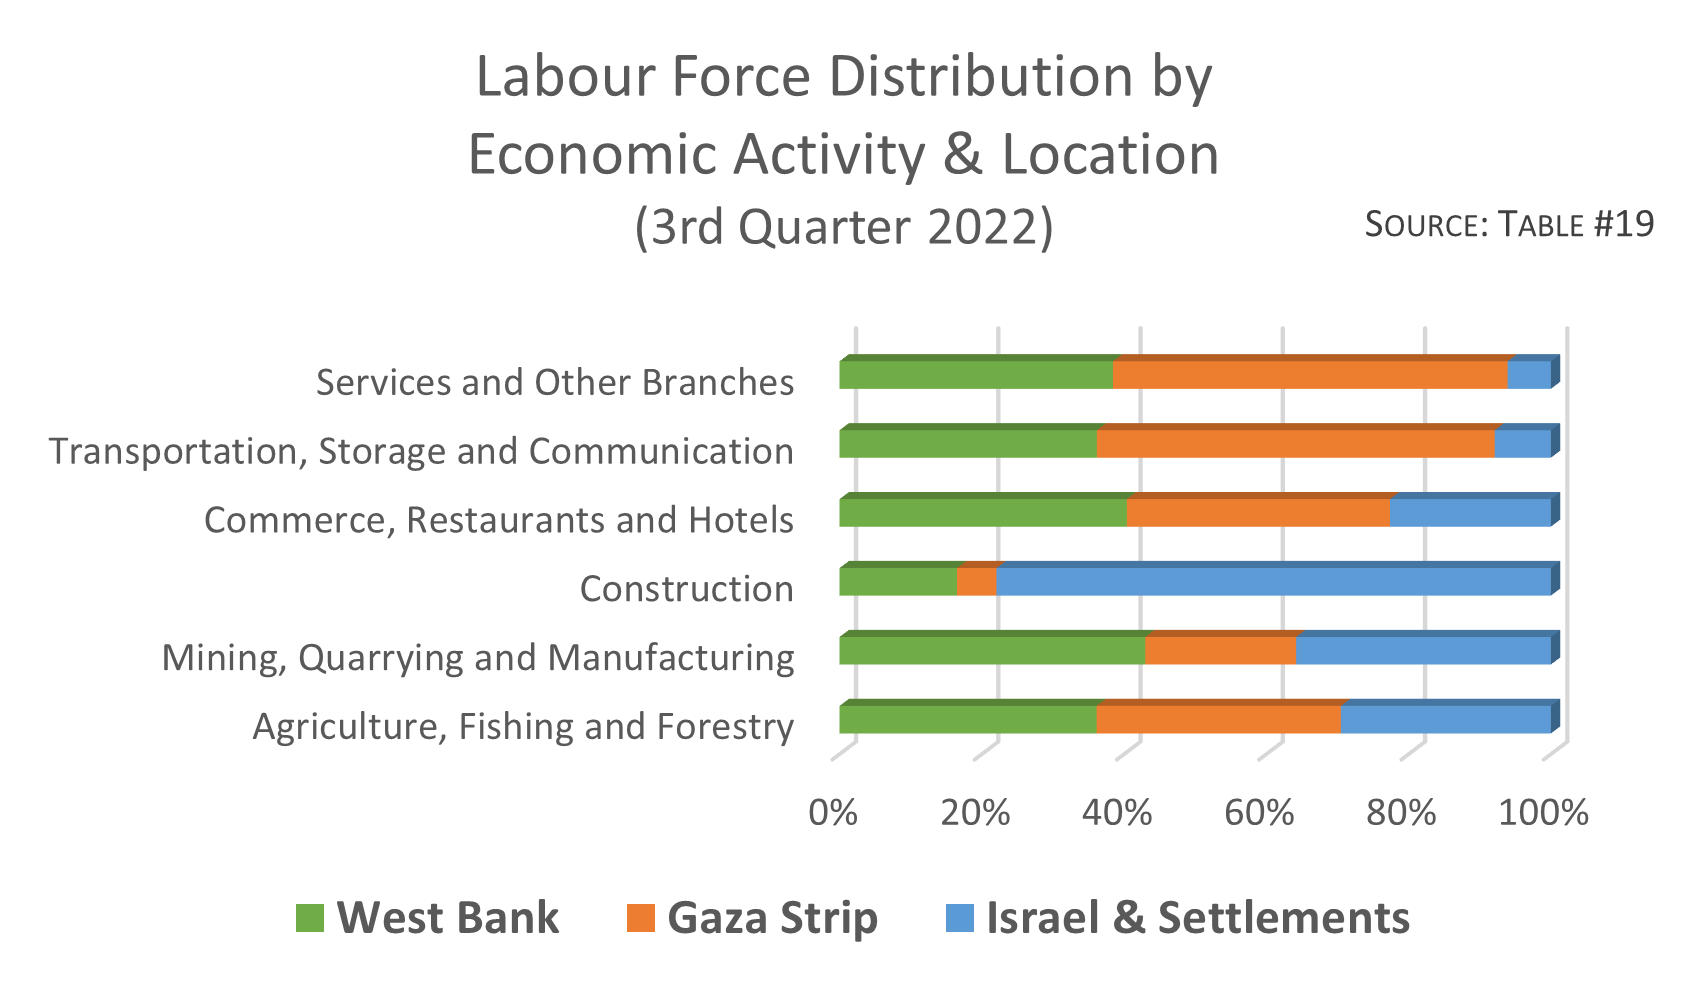
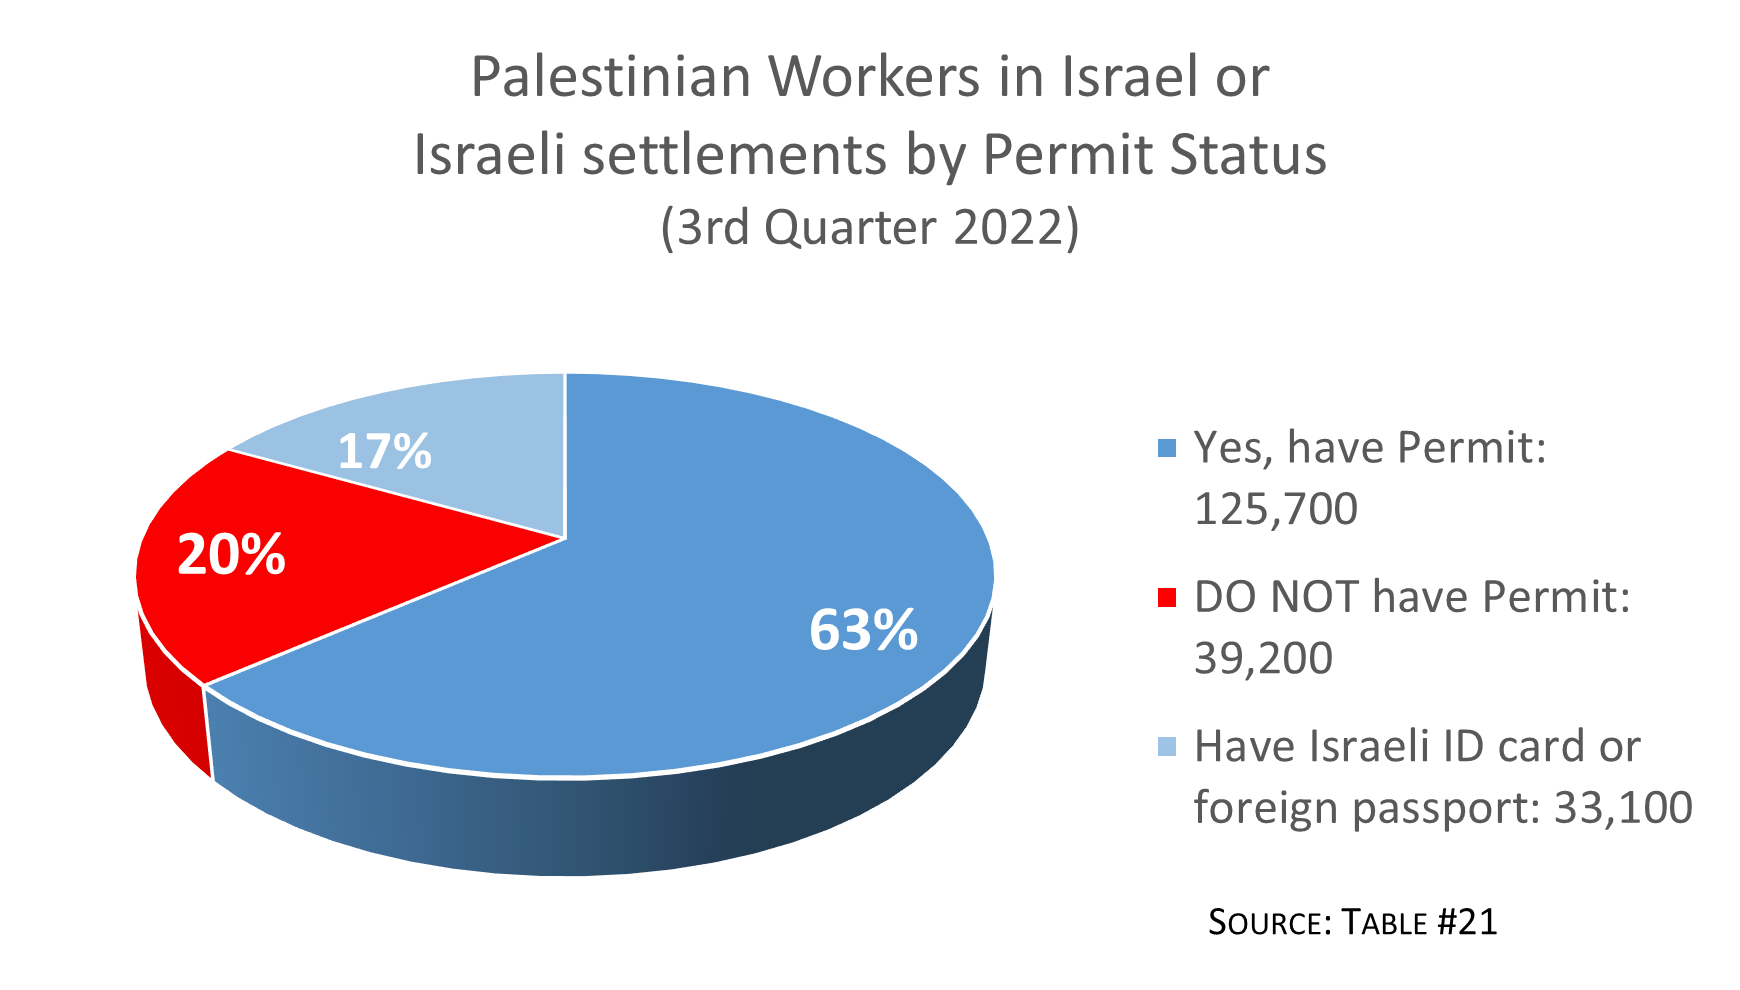
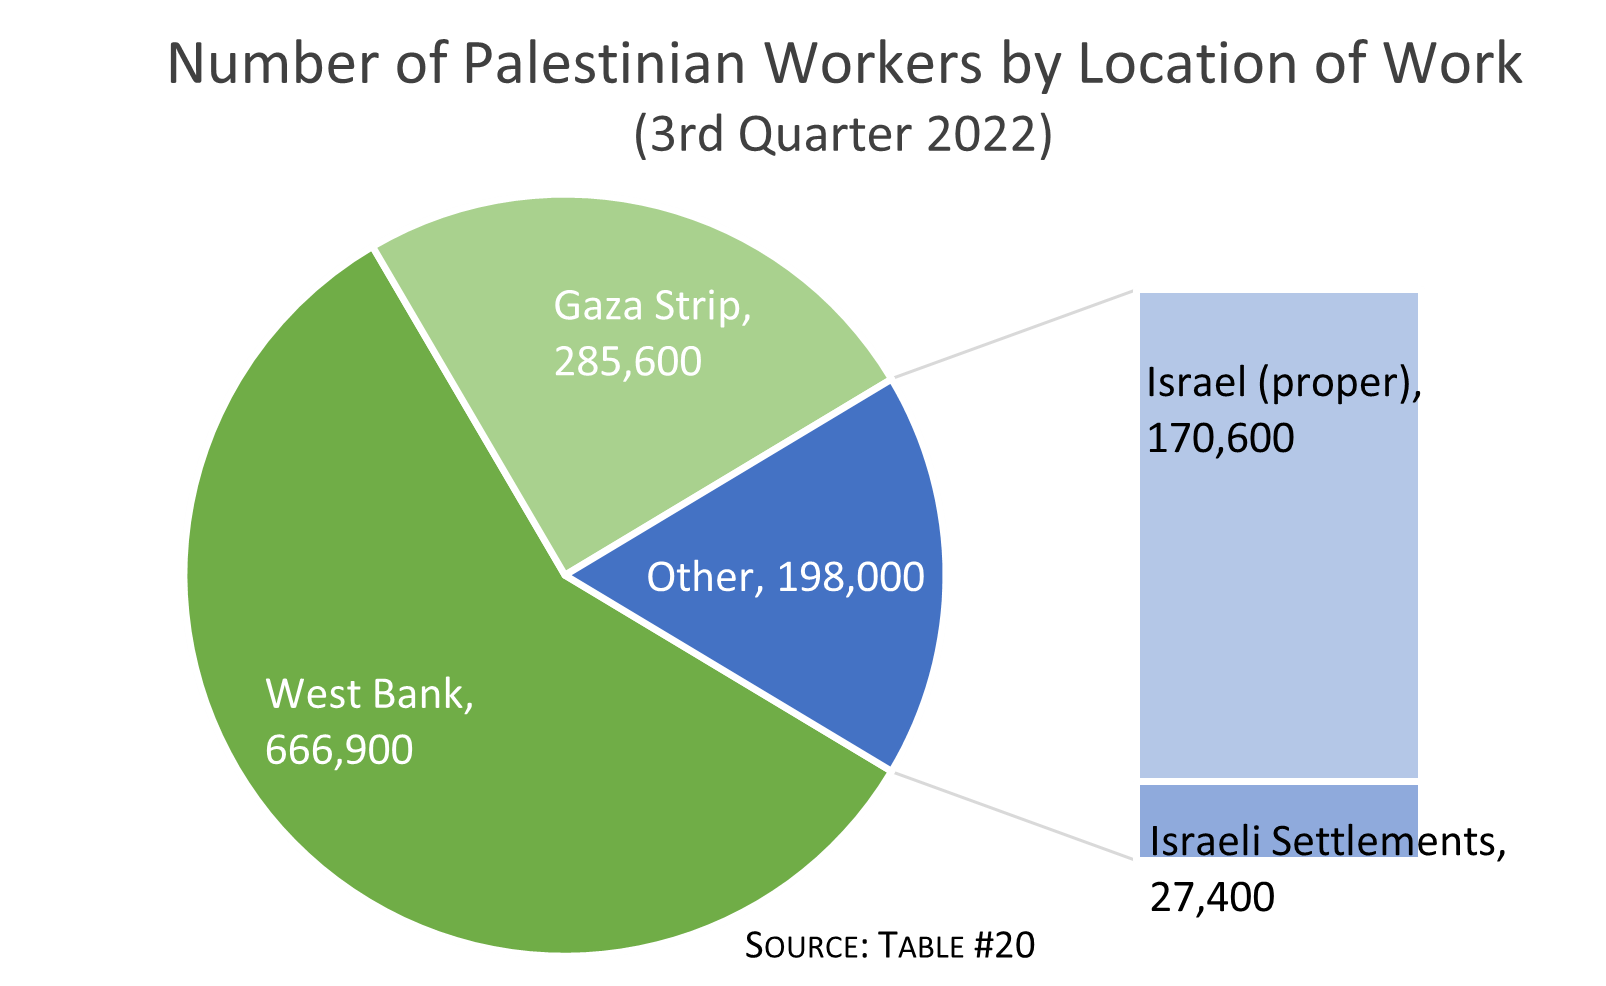
| Place of work – Palestinian Territories | 83% | 77% | 99% | #18 | ||
| Place of work – Israel & Israeli settlements | 17% | 23% | 1% | |||
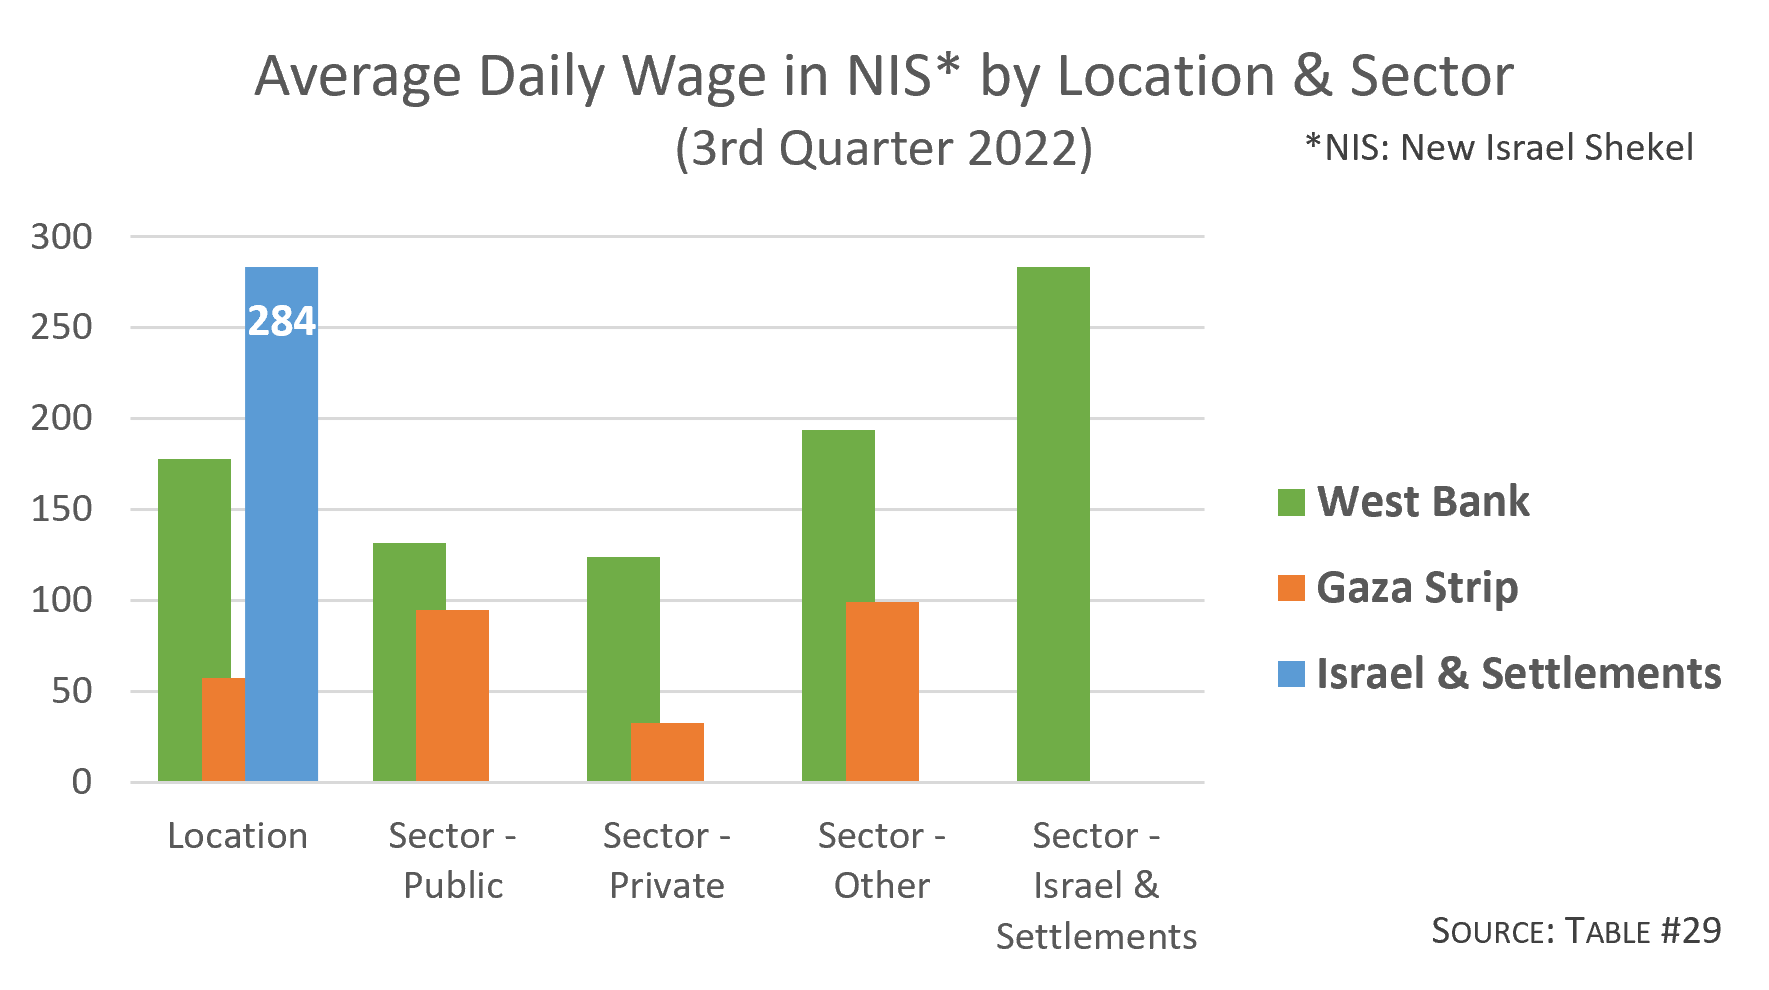
| Work sector – Public sector | 19% | 14% | 31% | #27 | ||
| Work sector – Private sector | 61% | 61% | 62% | |||
| Work sector – Other | 3% | 2% | 6% | |||
| Work sector – Israel & Israeli settlements | 17% | 23% | 1% | |||
| Trade Union membership | 19% | 13% | 35% | 25%** | 14%** | #35 |
| – (trade union membership) Males | 17% | 11% | 34% | |||
| – (trade union membership) Females | 27% | 23% | 42% | |||
| Child labour (aged 10-17yrs) | 4% | 5% | 2% | #36 |
* Palestine data from Labour Force Survey – 3rd Quarter 2022 (Jul-Sep), Palestinian Central Bureau of Statistics. “OPT”: occupied Palestinian territory (West Bank, Gaza Strip, East Jerusalem). “WB”: West Bank. “GS”: Gaza Strip.
^ Comparative data for Israel sourced from International Labour Organisation (ILOSTAT, 2021).
^^ Comparative data for Australia sourced from International Labour Organisation (ILOSTAT, 2021).
** ILOSTAT: Israel 2017, Australia 2018.