15 February 2022, Palestinian Central Bureau of Statistics (PCBS) [English / Arabic]
| DATA* | OPT | WB | GS | cf. Israel^ | cf. Aust.^ | Data Table |
| Labour force participation rate (15+yrs) | 44% | 46% | 40% | 62% | 65% | #1 |
| – (participation rate) Males | 70% | 74% | 62% | 65% | 70% | |
| – (participation rate) Females | 18% | 18% | 18% | 58% | 60% | |
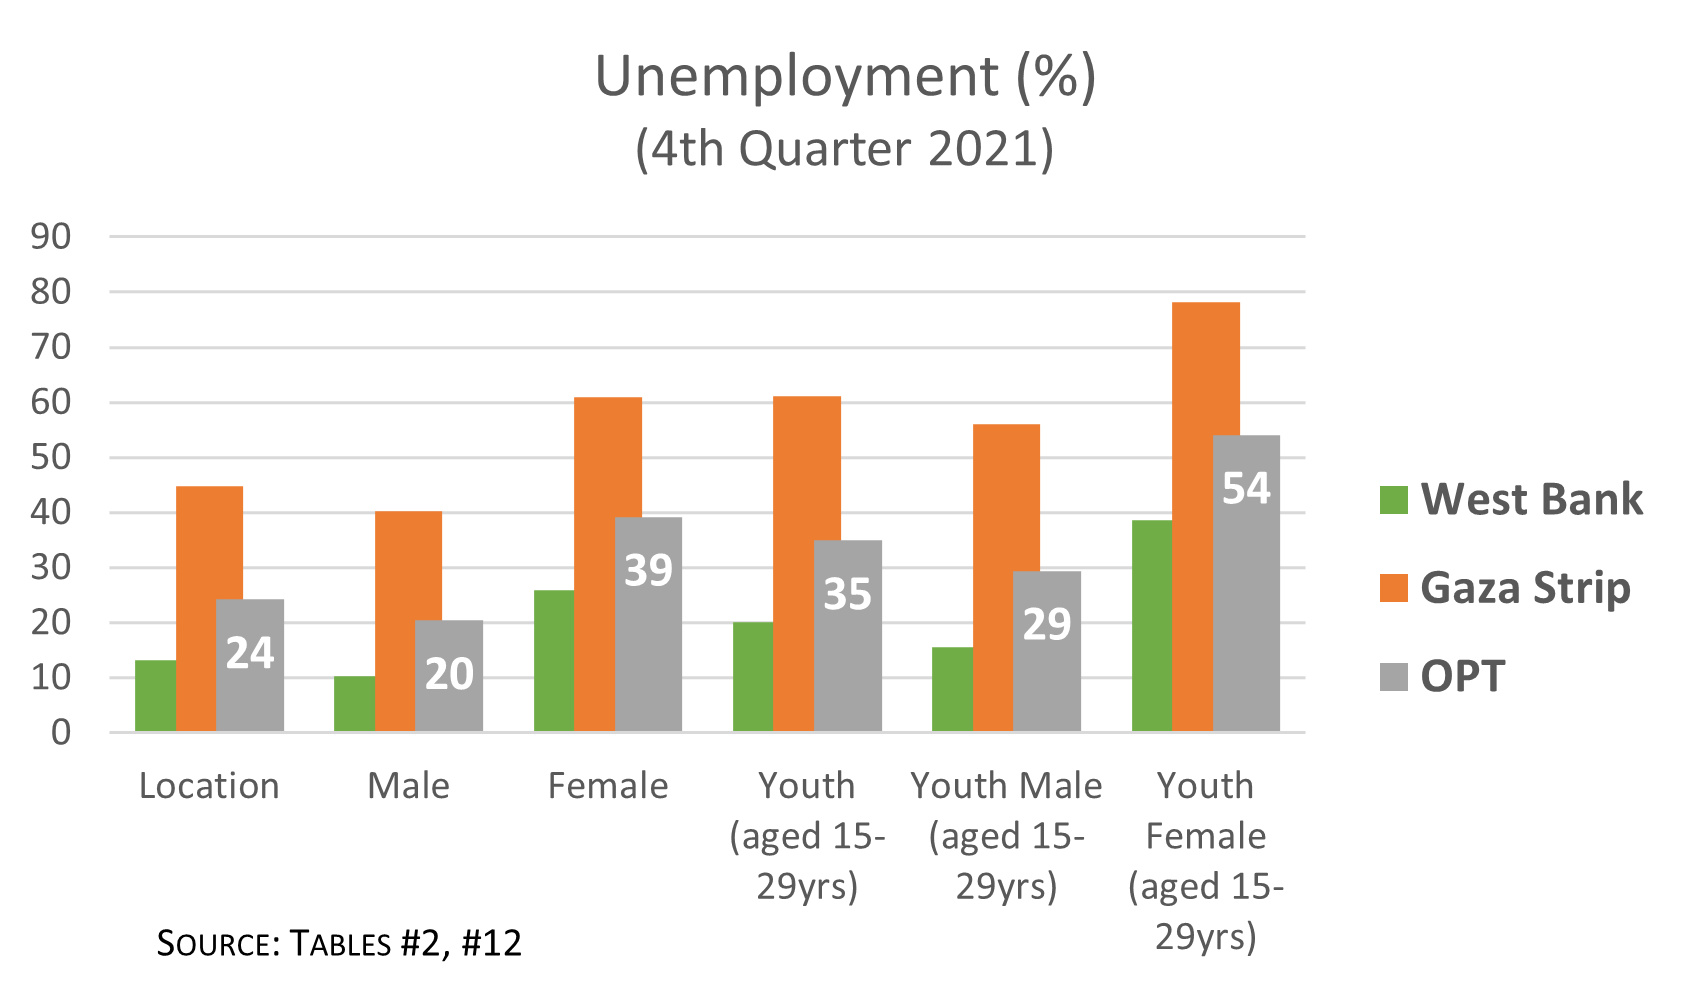
| Unemployment rate | 24% | 13% | 45% | 4% | 6% | #2 |
| – (unemployment rate) Males | 20% | 10% | 40% | 4% | 7% | |
| – (unemployment rate) Females | 39% | 26% | 61% | 4% | 6% | |
| Youth unemployment rate (15-29yrs) | 35% | 20% | 61% | 8%^^ | 14%^^ | #12 |
| – (youth unempl.) Males | 30% | 16% | 56% | 8%^^ | 15%^^ | |
| – (youth unempl.) Females | 54% | 39% | 78% | 8%^^ | 13%^^ | |
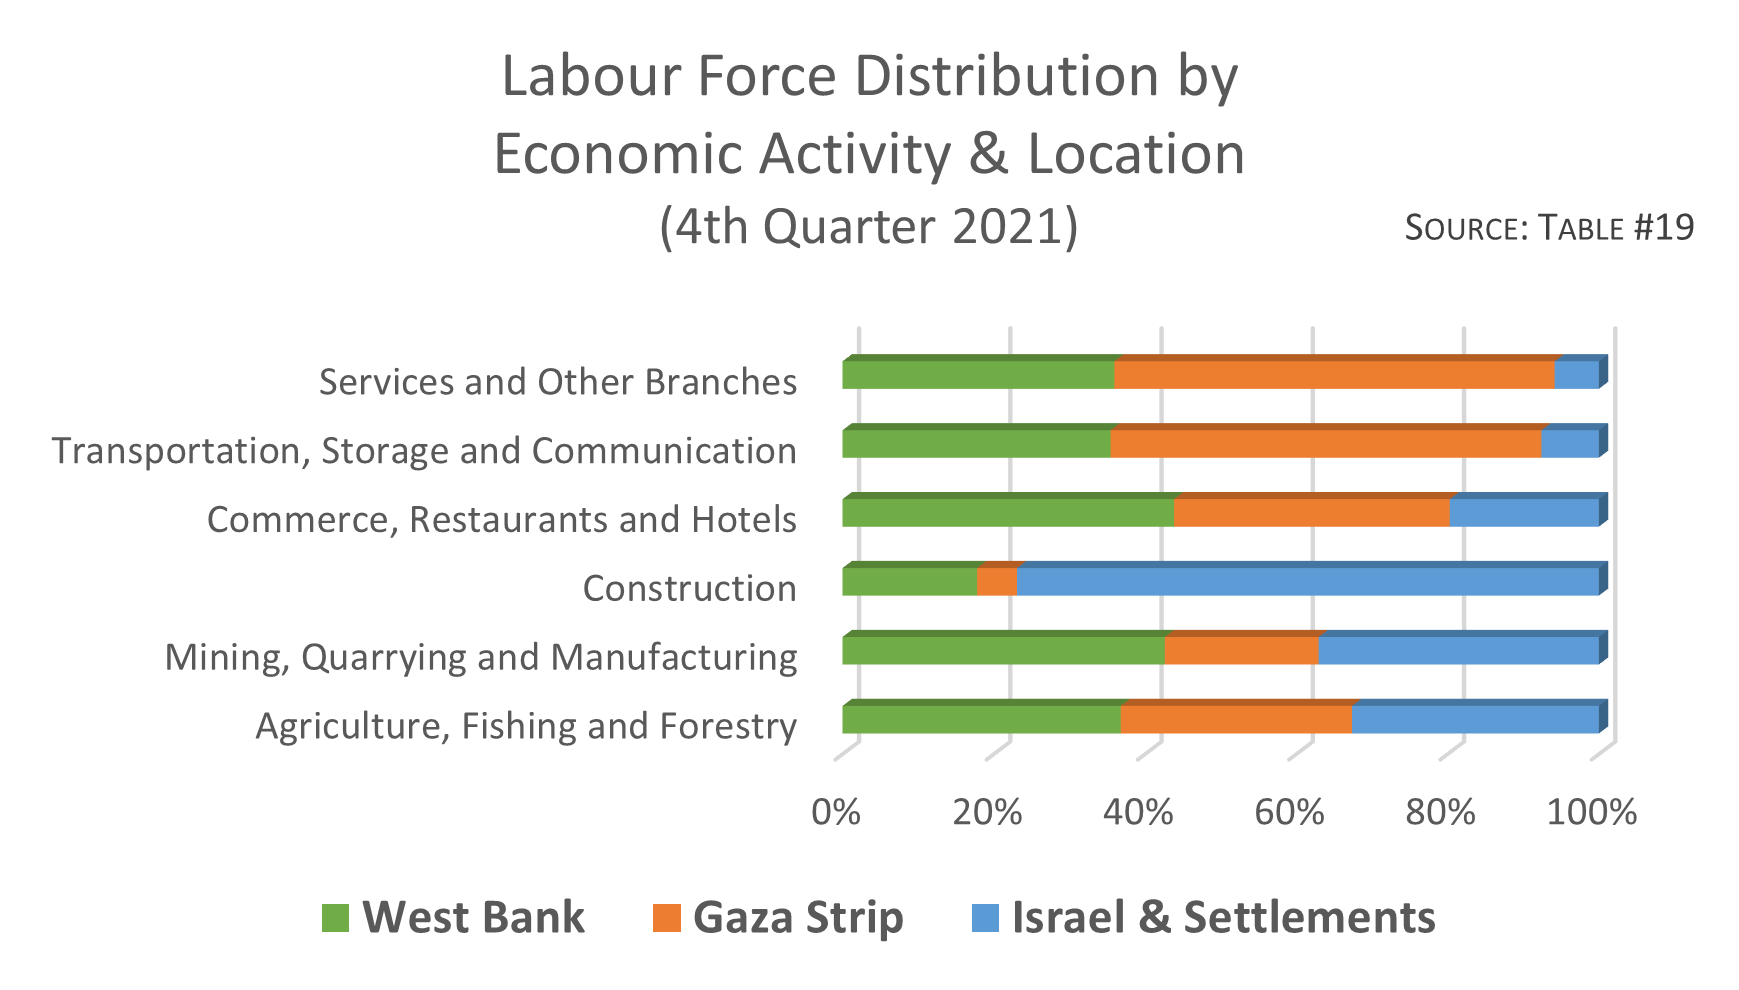
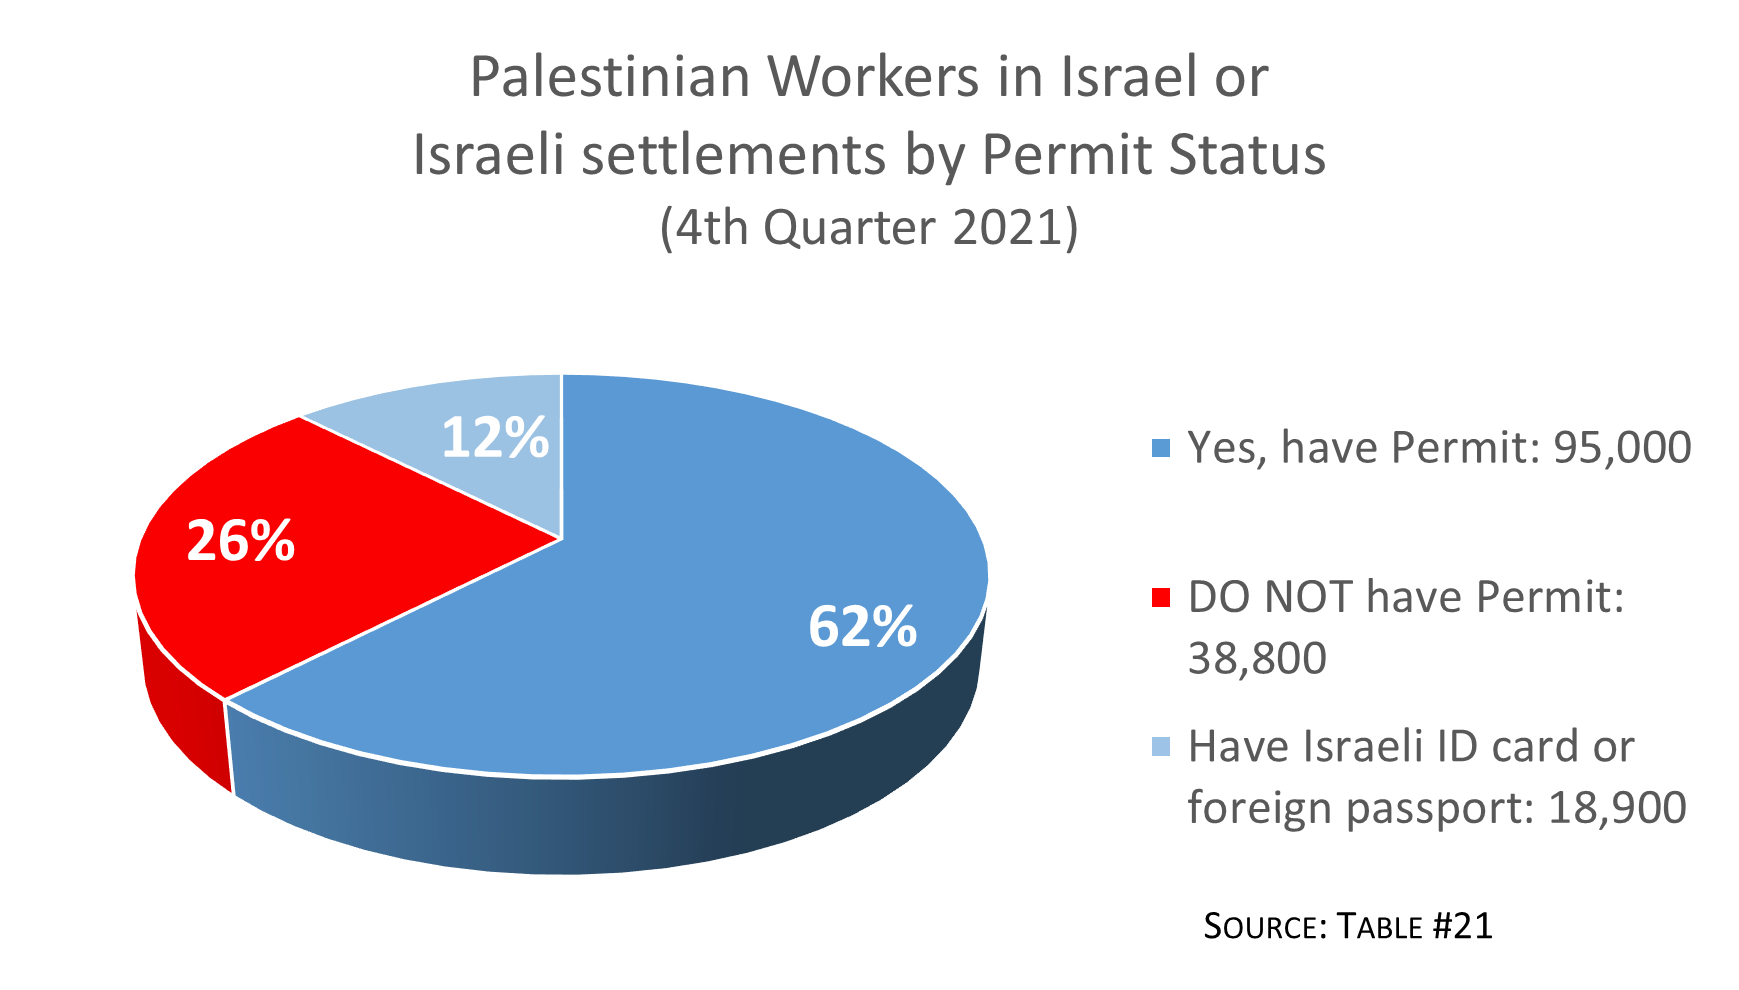
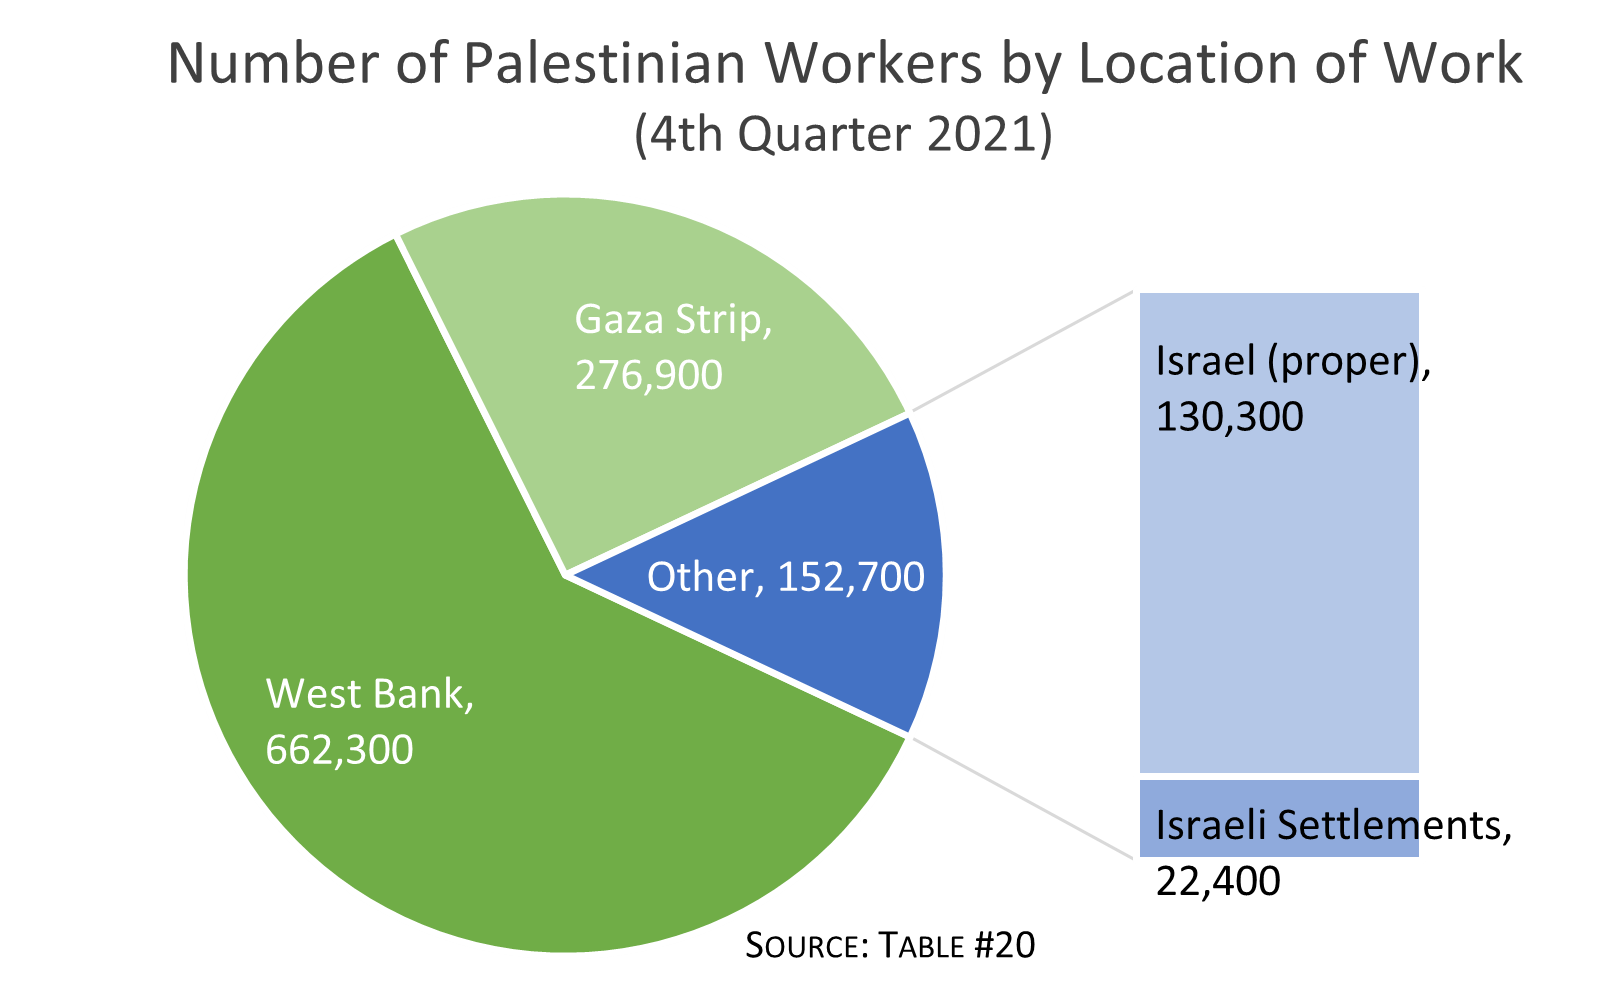
| Place of work – Palestinian Territories | 86% | 81% | 100% | #18 | ||
| Place of work – Israel & Israeli settlements | 14% | 19% | 0 | |||
| Work sector – Public sector | 19% | 14% | 33% | #27 | ||
| Work sector – Private sector | 63% | 65% | 60% | |||
| Work sector – Other | 4% | 2% | 7% | |||
| Work sector – Israel & Israeli settlements | 14% | 19% | 0.2% | |||
| Trade Union membership | 20% | 14% | 40% | 28%** | 15%** | #35 |
| – (trade union membership) Males | 19% | 12% | 40% | |||
| – (trade union membership) Females | 29% | 25% | 40% | |||
| Child labour (aged 10-17yrs) | 3% | 4% | 1% | #36 |
* Palestine data from Labour Force Survey, 4th Quarter 2021 (Oct-Dec), Palestinian Central Bureau of Statistics. “OPT”: occupied Palestinian territory (West Bank, Gaza Strip, East Jerusalem). “WB”: West Bank. “GS”: Gaza Strip.
^ Comparative data for Israel and Australia sourced from International Labour Organisation (ILOSTAT, 2020).
^^ ILOSTAT (2020) database definition of “youth” as 15-24 years of age.
** ILOSTAT, 2016.