8 May 2018, Palestinian Central Bureau of Statistics (PCBS) [English / Arabic]
| DATA* | OPT | WB | GS | cf. Israel^ | cf. Aust.^ |
| Labour force participation rate (15+yrs) | 45% | 45% | 46% | 64% | 65% |
| – (participation rate) Males | 70% | 72% | 68% | 69% | 71% |
| – (participation rate) Females | 20% | 17% | 25% | 59% | 60% |
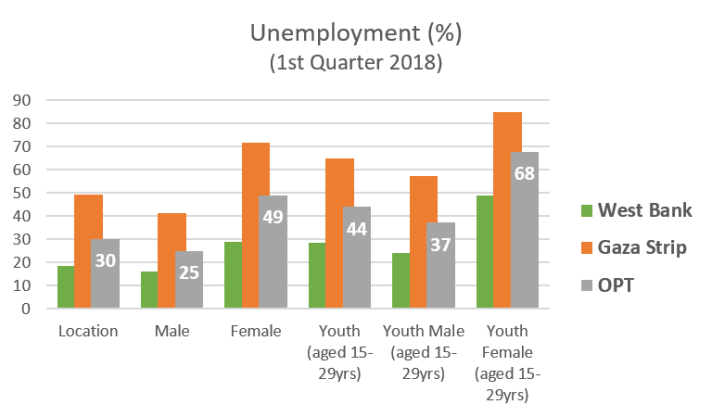
| Unemployment rate | 30% | 18% | 49% | 4% | 6% |
| – (unemployment rate) Males | 25% | 24% | 57% | 4% | 6% |
| – (unemployment rate) Females | 68% | 48% | 85% | 4% | 6% |
| Youth unemployment rate (15-29yrs) | 44% | 29% | 65% | ||
| – (youth unempl.) Males | 37% | 24% | 57% | ||
| – (youth unempl.) Females | 68% | 48% | 85% | ||
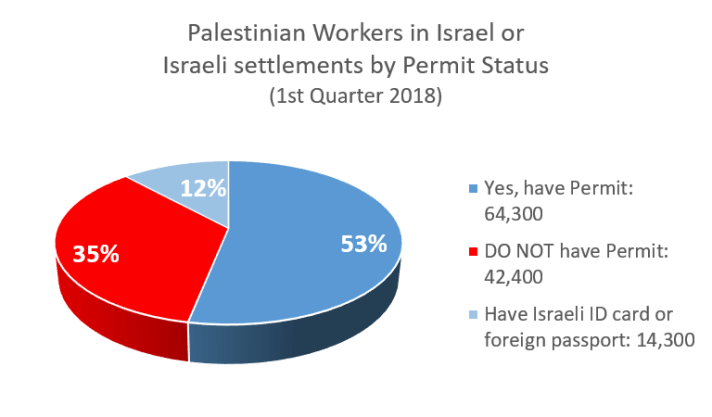
| Place of work – Palestinian Territories | 87% | 82% | 100% | ||
| Place of work – Israel & Israeli settlements | 13% | 18% | 0 | ||
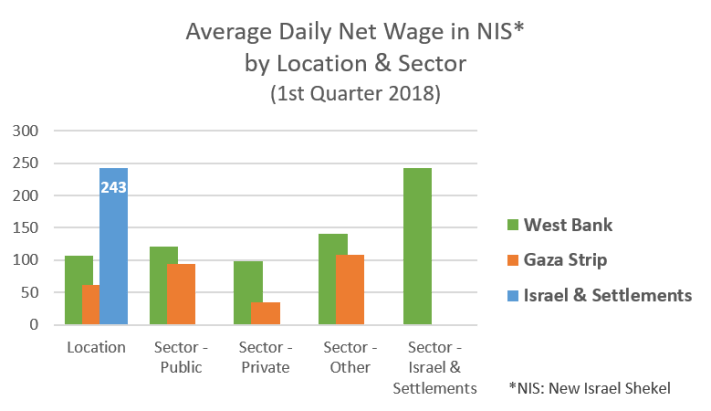
| Work sector – Public sector | 22% | 16% | 38% | ||
| Work sector – Private sector | 62% | 64% | 56% | ||
| Work sector – Other | 3% | 2% | 6% | ||
| Work sector – Israel & Israeli settlements | 13% | 18% | 0 | ||
| Trade Union membership | 19% | 14% | 33% | 26%^^ | 15%^^ |
| – (trade union membership) Males | 18% | 12% | 32% | ||
| – (trade union membership) Females | 26% | 21% | 40% | ||
| Child labour (aged 10-17yrs) | 3% | 4% | 2% |
* Palestine data from Labour Force Survey, 1st Quarter 2018 (Jan-Mar), Palestinian Central Bureau of Statistics. “OPT”: occupied Palestinian territory (West Bank, Gaza Strip, East Jerusalem). “WB”: West Bank. “GS”: Gaza Strip.
^ Comparative data for Israel and Australia sourced from International Labour Organisation (ILOSTAT, 2017).
^^ ILOSTAT, 2016.